ATS Tracker
Installation
ATTS Tracker download URL: https://actiontestscript.org/tools/ats-tracker/
You can retrieve this URL directly from the side bar in Agilitest, in the ATS Tracker menu.
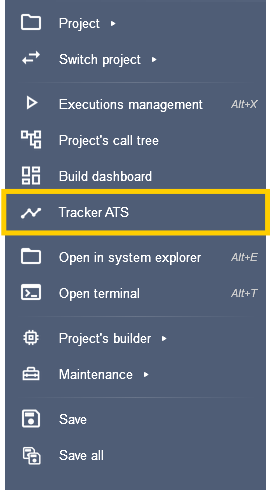
Then, click on the “Install” button
This will open a web page in which you can find details about the installation on Linux and on Windows.
To use ATS Tracker you can plan to use a dedicated server Linux or Windows or you can use your local machine (localhost).
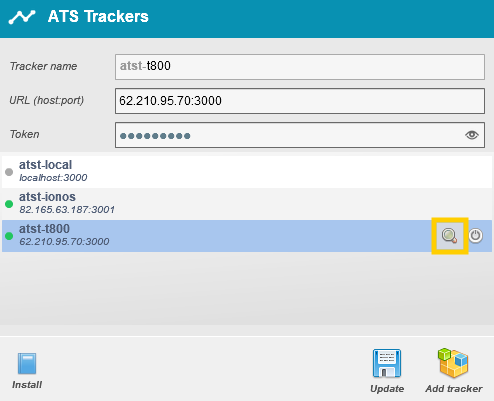
ATS Tracker configuration
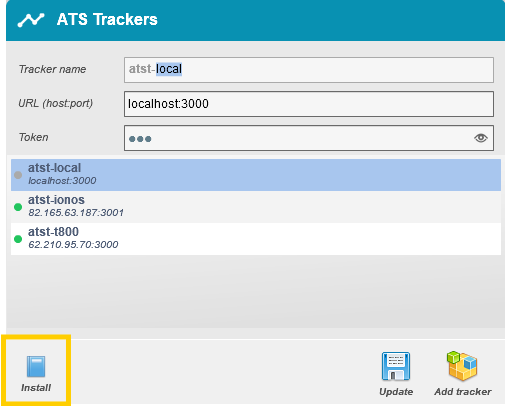
You can add a Tracker to your list. To do that, the id of the Tracker needs to be unique.
There are 3 states possible for your trackers:
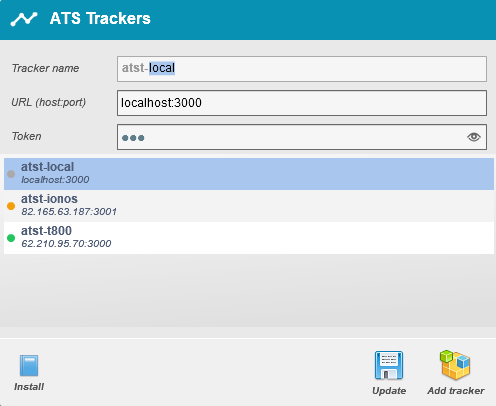
- Grey point: Disconnected or Tracker not found
- Orange point: The access exist but the Token entered is incorrect
- Green point : the Tracker is connected and functional
How to use a Tracker
The tracker can be included in your executions.
Do a right click on your script > Run the script > Command lines
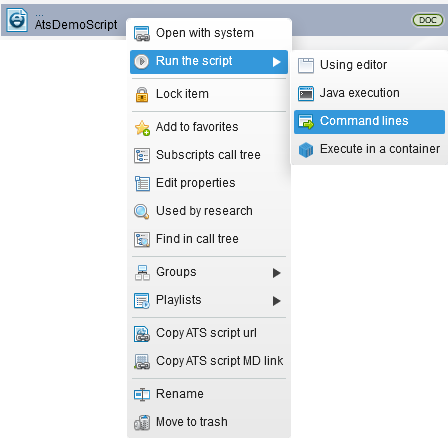
From the test case command lines pane you can choose to add a tracker from your trackers’ list.
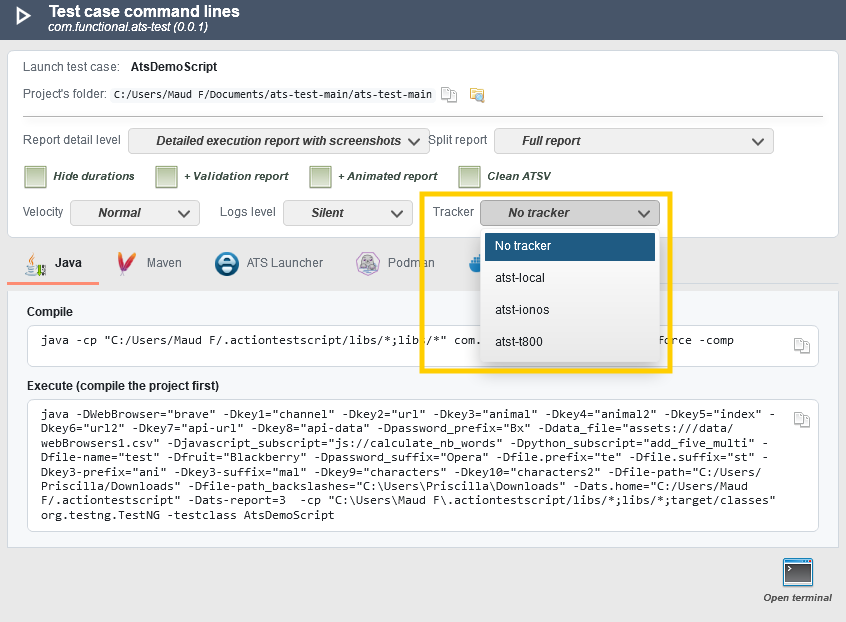
The tracker is active during your tests execution and results from the current tests will be saved in the database of the selected tracker.
Tracker console
To open the tracker console you can click on the magnifying glass icon on the corresponding tracker you want to open.
This will open your tracker URL.
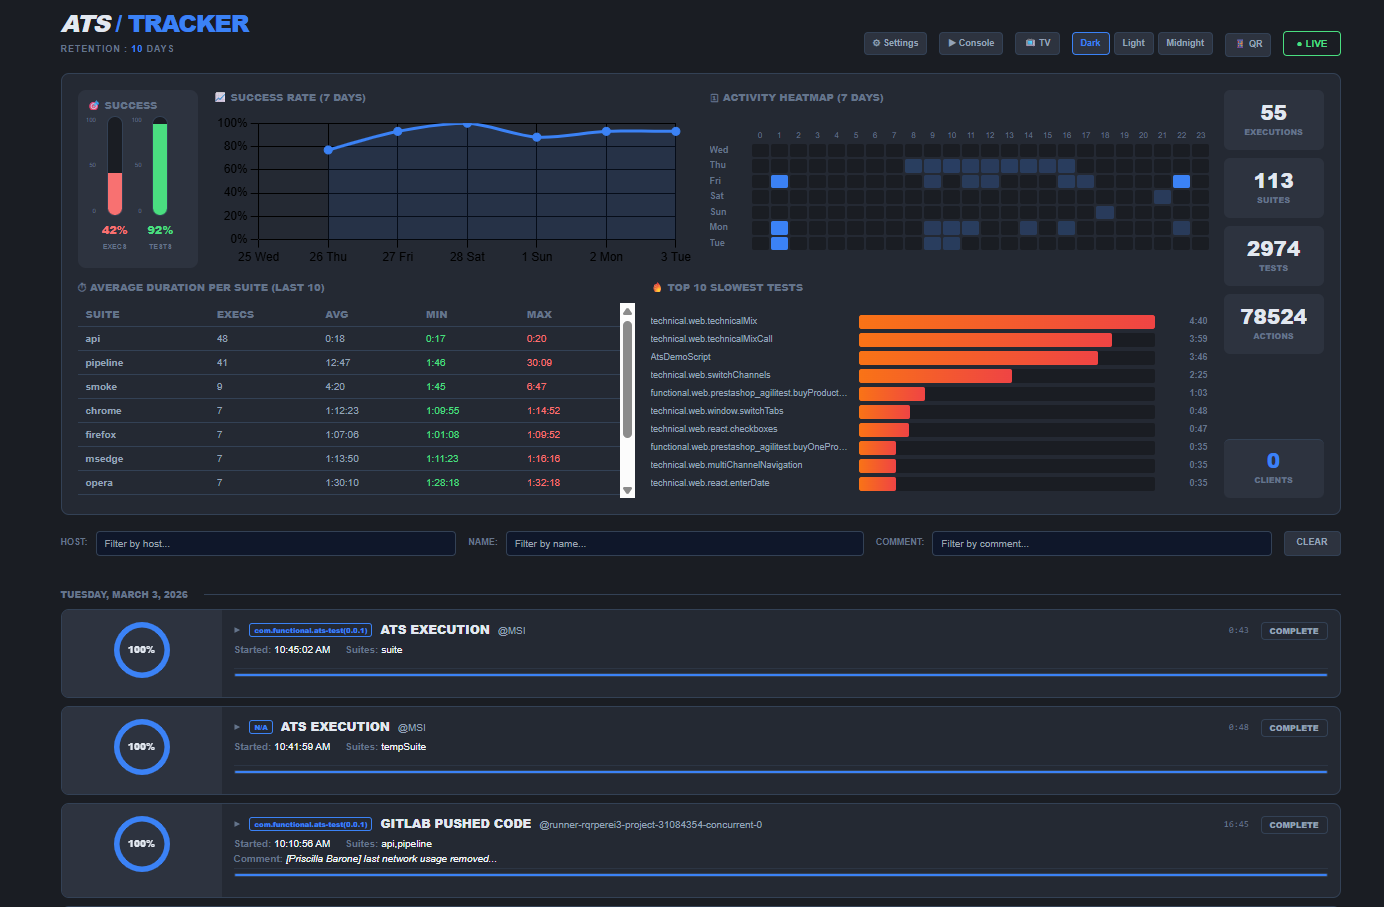
On this page, various information are displayed:
- Results gauge
- Average execution time
- Activity map
- Various visualization modes (TV, dark, light,...)
- Actions number, tests number, executions number…
- Etc…
The latest executions launched are also listed at the bottom of the page.
When you run a test with a Tracker, the execution of that test also appears in real time.
Dashboard
The Dashboard is generated automatically at the end of each execution.
To visualize the dashboard, open the system explorer from Agilitest
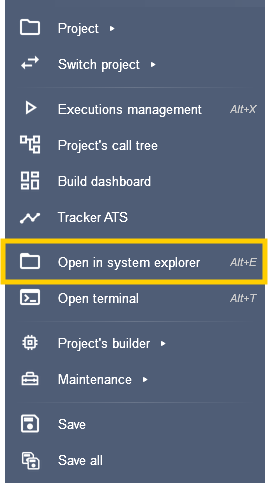
Then, click on target > ats-output and click on the dashboard in HTML format
The dashboard displays various information:
- Tests status
- Tests number
- Actions number
- Actions types
- Etc…
The information on the dashboard is static, unless it is executed with the Tracker.
When Tracker is included in executions, a green icon appears at the top left of the page.
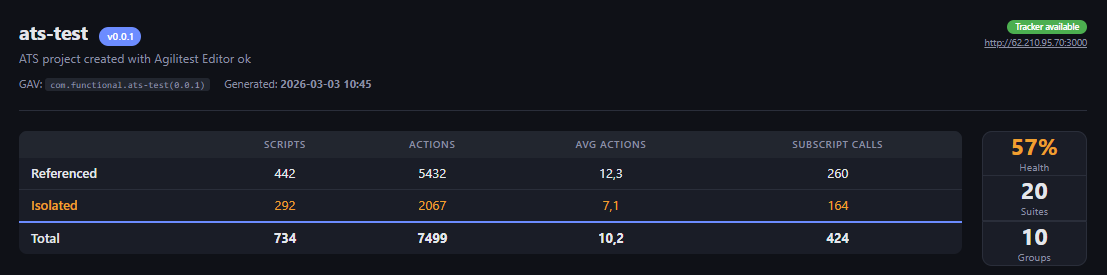
Some of the information are dynamic and synchronized with the Tracker data.
Example:
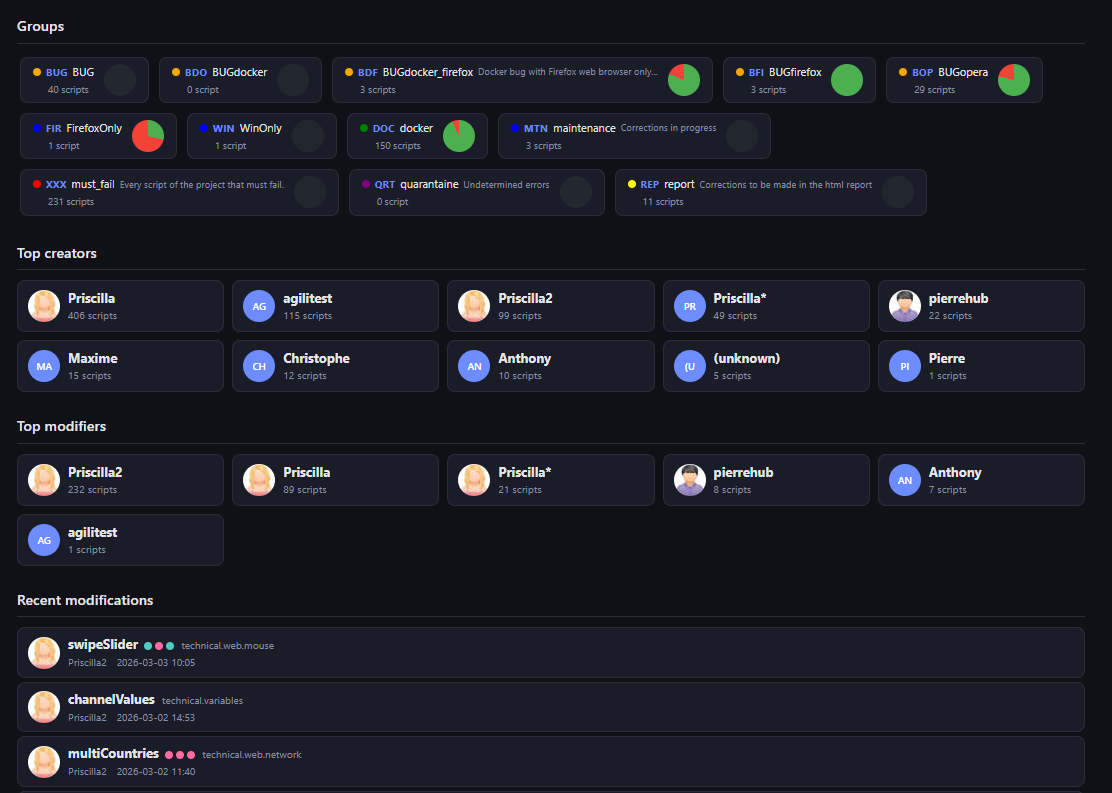
The test results pie chart, recent changes...
