

Dashboard
The dashboard built into the Agilitest ecosystem is not just a post-execution report, but a tool for static analysis and assessing the overall health of your test project.
When your tests are executed (whether from the Agilitest interface or via the command line using ats-core), the engine logs absolutely everything that happens:
- The actions performed (clicks, keystrokes, submissions).
- The execution time for each step.
- The action status (Success / Failure).
- Screenshots or video recordings of the actions.
Le dashboard compile et croise les données techniques du projet pour fournir une vue d'ensemble de votre patrimoine de tests :
- Il comptabilise le nombre de scripts, le volume d'actions globales et la répartition du travail par auteur.
- Il mesure le taux de couverture de vos scripts au sein des différentes suites d'exécution (les fichiers TestNG XML).
- Il suit l'activité de versioning Git et l'historique d'édition pour identifier les scripts fréquemment modifiés ou abandonnés.
- Il met en lumière les tests dits flaky (instables), liste les scripts qui n'ont jamais été exécutés et analyse les durées de passage pour repérer les goulots d'étranglement.
The dashboard compiles and cross-references technical project data to provide an overview of your test portfolio:
- It tracks the number of scripts, the total volume of actions, and the distribution of work by author.
- It measures the coverage rate of your scripts across the various execution suites (TestNG XML files).
- It tracks Git versioning activity and edit history to identify frequently modified or abandoned scripts.
- It highlights so-called “flaky” (unstable) tests, lists scripts that have never been executed, and analyzes execution times to identify bottlenecks.
Configure the Dashboard
The button to access the dashboard is located directly in the left sidebar of the editor.
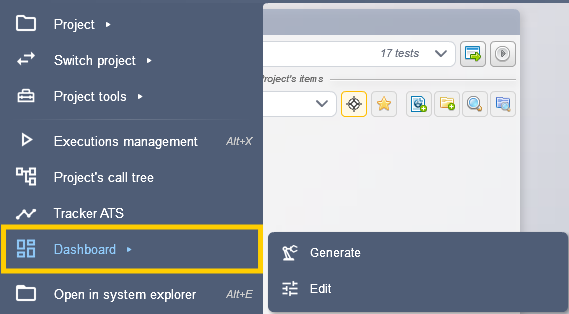
The “Edit” menu lets you show or hide sections of metrics grouped by theme.
All your dashboard section configurations and exclusions are saved directly to the project's metadata file.
Dashboard’s parameters
You can customize the display of your Dashboard from the Agilitest editor.
Open the left sidebar > Dashboard > Edit
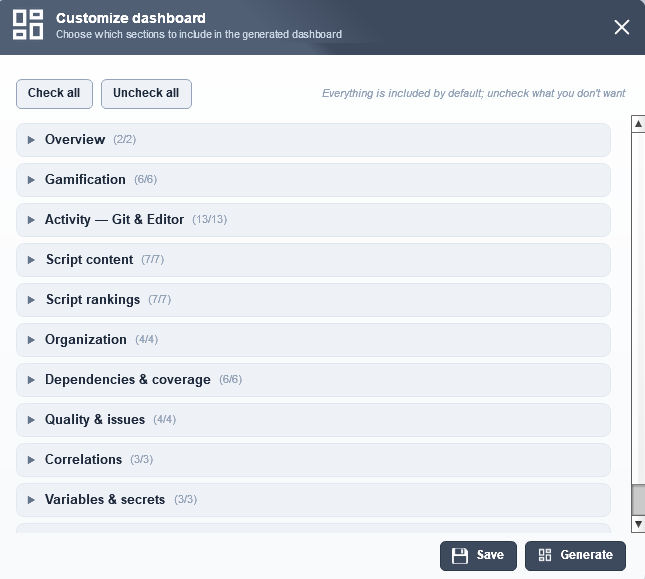
From this interface, you can choose to show or hide certain information depending on your report's audience (for example, hide Git history, complexity, or suite coverage if it's not relevant).
Some examples of parameters:
Tracker
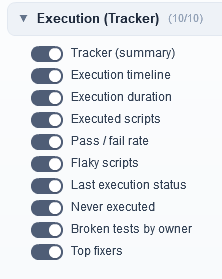
You can configure an optional tracker.
Integrating a tracker allows you to display advanced metrics from your previous runs in the dashboard, such as execution times, flaky tests, or tests that have never been run.
Gamification
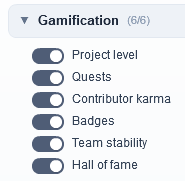
Gamification helps boost team engagement by making progress tracking visual and fun. The dashboard fuels this momentum through:
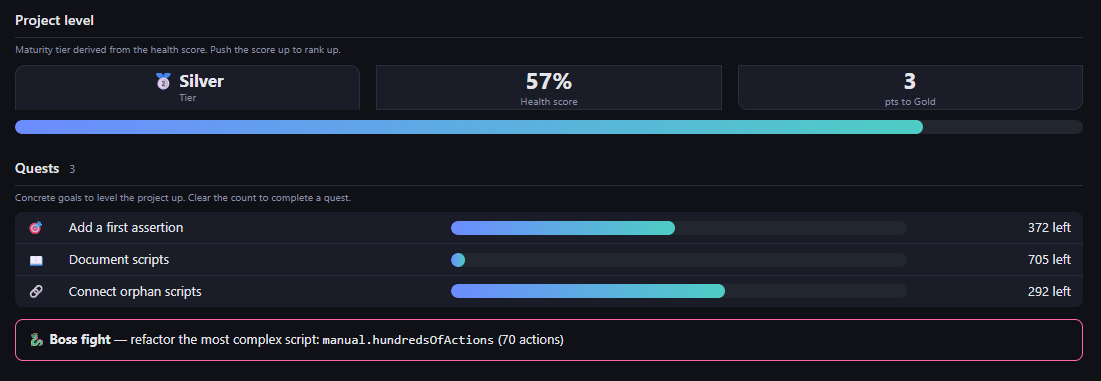
- Git Activity and Editor History: The system tracks interactions and changes to scripts over time, reflecting the team’s ongoing efforts.
- Debugging: By openly listing scripts flagged as “flaky” (unstable) or scripts that have never been executed, the dashboard sets clear “cleanup” and stabilization goals for the team.
- Goal Progress: Tracking test suite coverage serves as a gauge of collective progress toward delivery.
This section highlights statistics on individual users to showcase the work they’ve accomplished. This data is directly linked to the publisher’s identity management system.
In a section called “Hall of Fame,” the dashboard attributes scripts and actions to their respective authors, highlighting the project’s most active contributors.

The dashboard can measure the algorithmic complexity of test scenarios. Successfully maintaining or simplifying complex test suites has become a key metric for highlighting the expertise of test automation engineers.


