

Network traffic management
In Agilitest, network logging and capture is a feature that allows you to record network traffic (HTTP requests, loaded resources, response times) generated by a browser or application while an automated test is running.
Network declarations
By default, “performance” mode (network capture) is not enabled to avoid overloading standard test runs.
There are two ways to activate the network capture:
- Declare a script of network capture “type”
In the top-right corner of your script, in the menu, click on “Manage Network traffic”
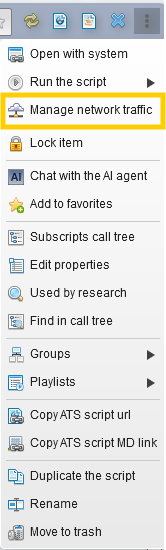
- From the start channel action
In your test script, in the Start Channel action, you must enable the “HAR Recording” option
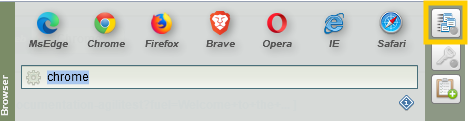
This tells the ATS-core to attach the listening proxy to the launched browser.
Once you have enabled the network capture, a button will appear in the channels management.
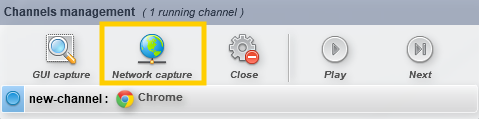
Then, you can open the network capture window when the started channel as reached a website in which you want to check the network.
Click on the network capture button from the channels management or the Network declarations panel.
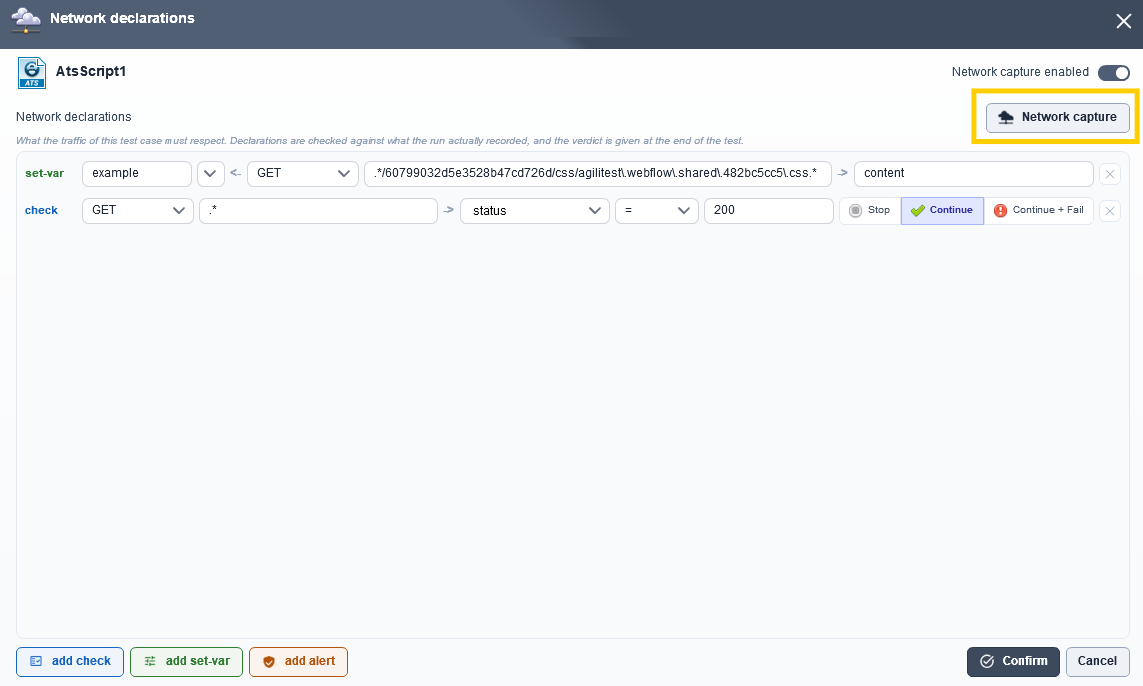
Select the request you want to control during your test
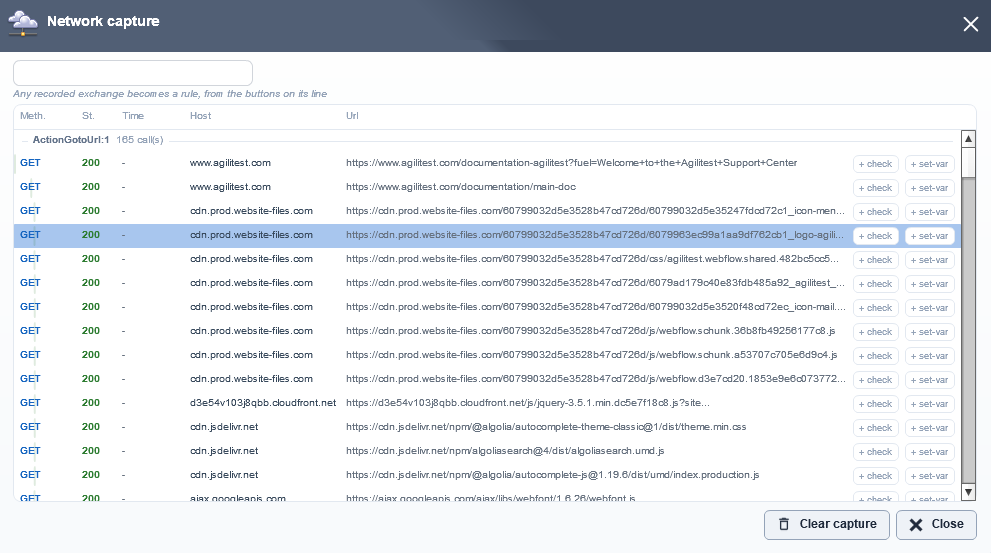
Then click on one of the rules:

Check rule:
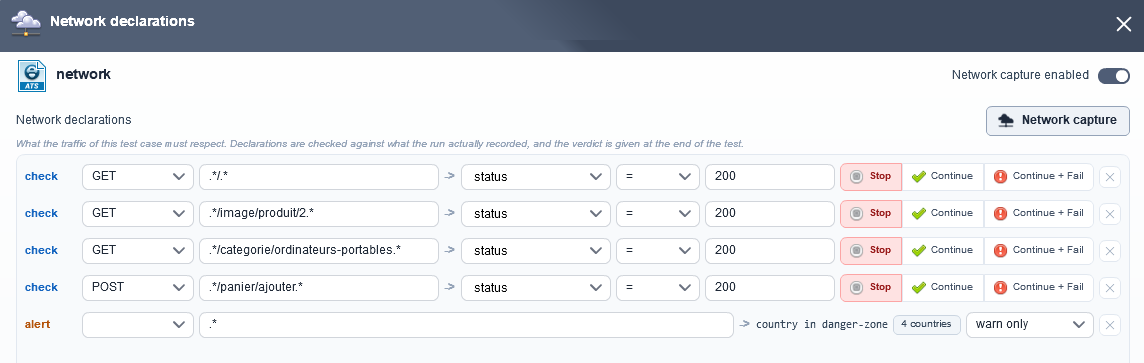
With the “check” rule, you can select which conditions needs to be completed in order to pass the test (status, duration, url, method, host, path, mime, content, size, occurrences)

You can also decide what happens to the test if the rule is not completed, whether to stop the test, fail the test or only make it appear in the report.

Variable rule:
You can set a variable, give it a name and retrieve its content

At the top of script, a button indicates that the script is under network capture and how many rules it is composed of
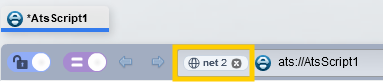
Click on the button to open the Network capture window.
Alert rule:
Agilitest allows you to add network validation steps to verify that clicking a button has indeed triggered the expected API call with the correct parameters.
Reports
All the parameters set up in the network declarations panel will be given a status at the end of the execution and appear in the reports
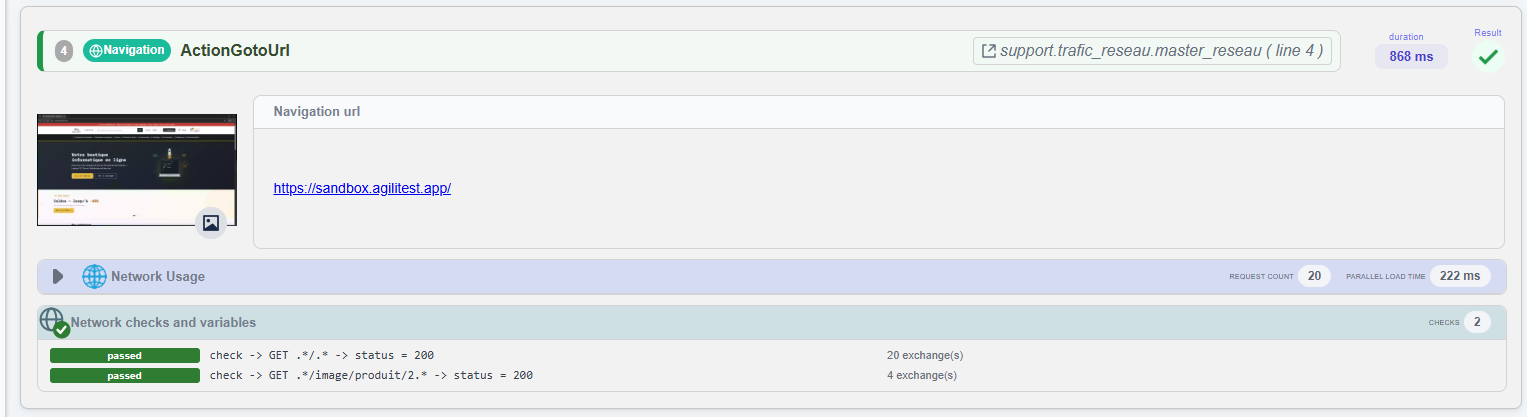
Each failed is also explained regarding the rule set up in the network traffic

Real-time and asynchrone results
🔸Warning
Everything regarding the network is asynchronous, which differs with step by step running actions in Agilitest.
It is this asynchronous nature of the network, the fact that data arrives whenever it can, with varying delays, that requires waiting until the end of the sequence to check for a minimum threshold.
A check for the minimum number of occurrences found will be evaluated at the end of the test, whereas a check for the maximum number of occurrences will be evaluated as soon as one more occurrence is detected.
As long as the test is running, the counter increments the number of observed requests. It is only when the capture is stopped (or an explicit check is performed) that the engine compares the total to the expected threshold. If the numbers don't match, the test fails at that point
Network capture action
Agilitest also has a network capture action that can have an impact on the network declarations of your script.
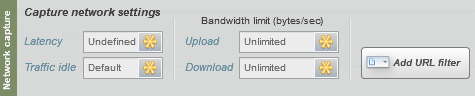
- Set Parameters Action (Configure Capture): This action allows you to dynamically modify network conditions during the test to simulate different use cases or filter data:
- Latency: To simulate a poor connection by adding artificial wait time in seconds to each request.
- Upload / Download: In bytes per second—useful for testing the performance of a web interface on a 3G or 4G network, for example.
- Traffic idle: To capture network activity only from a specific API or domain during a specific test phase.
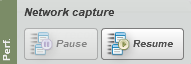
- “Record” Action (Start/Stop Recording): Unlike passive global recording, Agilitest allows you to start, pause, or resume recording on a per-action basis. This enables you to isolate network traffic to a specific critical sequence (such as the payment process) and generate a streamlined, relevant HAR file.
Practice cases
- Measuring the exact execution time (or the time from point A to point B in the script)
Traffic is recorded in a standardized format (HTTP Archive). You can inspect headers, request and response bodies (JSON/XML payloads), the URLs accessed, and HTTP status codes (200, 404, 500, etc.).
While testing this aspect, you can use the network activity action to limit bandwidth or artificially introduce latency to test how the application behaves on slow connections (3G, fallback mode, network outage).

- Check to see if certain actions (network calls in the traffic) are taking too long
The proxy allows you to intercept a specific request and return a simulated response (custom payload or error code) without involving the actual backend server. This is useful for testing the interface's resilience to API errors or out-of-bounds data.


